SCILAB Templates
===========================ONE_LINERS==========================================
-->a=1 // a=1. load a real constant
-->1==1 // ans=T load a boolean
-->m=0 // ans=T load a boolean
-->~m // ans=T tilda — (~) logical not
-->'string' // ans=string load a character string
-->path='/Users/donsauer/Downloads/' //
-->filepath=path +'filename' // filepath= /Users/donsauer/Down...
-->who_user() // User variables = filepath, path, m, a,home
-->%i // %i (for sqrt(-1))
-->%inf // %inf (for Infinity)
-->%pi // %pi (for 3.14...)
-->%T // %T (for "true")
-->dec2bin(7,
4)
// 0111
-->length('hello
world')
// 11.
-->bin2dec('1010') // 10
-->dec2hex(14) // E
-->hex2dec('E')
// 14
-->int(3.14) // 3
-->floor(3.14)
//
3
-->ceil([1.9 -2.5])
//
2. -2.
-->[m,n]=max([1,3,2]) // n=2,m=3
-->[m,n]=min([1,3,2]) // n=1,m=1
-->sign(-33) // -1
-->sqrt(-1)
// i
-->modulo(-3,9) // -3.
-->[n,m]=size(rand(3,2)) // m = 2. n = 3.
-->[n,m]=size(['a','b';'c','d']) // m = 2. n = 2.
-->abs([1,%i,-1,-%i,1+%i])
// 1. 1.
1. 1. 1.4142136
-->n=input("How many iterations?") // wait for input
-->ascii("scilab") // 115. 99. 105. 108. 97. 98.
-->ascii([115 99 105 108 97 98]) // scilab
-->home // home = /Users/donsauer
-->getos() // ans = Darwin
-->getshell() // ans = bash
-->gethistory //
-->historysize()
-->savehistory('/session.scilab')
-->testmatrix('magi',3) // returns a magic square of size 3
-->testmatrix('frk',3) // returns the Franck matrix :
-->testmatrix('hilb',n) // inverse nxn Hilbert matrix (Hij= 1/(i+j-1)).
===========================MISC==================================================
-->a=1; b=2; // define a and b
-->Z=['a','sin(b)'] ; // define Z as an array of equations
-->eval(Z)
// returns
the matrix [1,0.909];
-->date=struct('d',25,'m','DEC','y',2006)
// create a struct date
-->date.m='AUG';
-->date.y='1973';
--> for j= 4:-1:1, disp(j),end
// 5. 4. 3. 2. 1.
--> i=2
for j = 1:3,
if i == j then a(i,j) = 2;
elseif
abs(i-j) == 1 then a(i,j) = -1;
else
a(i,j) = 0;
end,
end
-->x = linspace(-10, 10, 5) // x = - 10. - 5. 0. 5. 10.
-->x = logspace(1,2,5) // x = 10 17.8 31.6 56.2 100
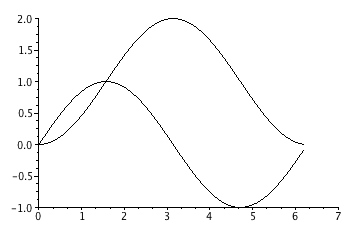
-->x0=0;
-->x1=0:0.1:2*%pi;
-->x2=sin(x1);
-->x3=integrate('sin(x)','x',x0,x1); // integrate('equa','value',x0,x1);
-->plot2d(x1,x2);
-->plot2d(x1,x3);
===========================ARRAY==================================================
-->A=[a+1 2 3
--> 0 0 atan(1)
--> 5 9 -1 ] // load a 3 x 3 constant matrix
A=2. 2. 3.
0. 0. 0.7853982
5. 9. - 1.
-->A(2,3)
//
ans = 0.7853982
-->x = rand(3, 2) // load a 4 x 4 constant matrix
x = 0.2113249
0.3303271
0.7560439 0.6653811
0.0002211 0.6283918
-->x(:,1)
=
0.2113249
0.7560439
0.0002211
-->x(:,2)
=
0.3303271
0.6653811
0.6283918
-->x(1,:)
// ans
= 0.2113249 0.3303271
==========================READ/WRITE_FILES=====================================
-->x = rand(3, 2) // load a 4 x 4 constant matrix
x = 0.8497452 0.0683740
0.6857310 0.5608486
0.8782165 0.6623569
-->x(1,2) // ans = 0.0683740
-->path='/Users/donsauer/Downloads/scilab/' // directory to save files
-->save(path+'BinFile.sci', x) // Save x as a Binary file
-->clear x // x is clear
-->x // !--error 4 Undefined variable: x
-->load(path+'BinFile.sci') // Load from Binary file the x array
-->x
x = 0.8497452 0.0683740
0.6857310 0.5608486
0.8782165 0.6623569
-->write(path+'TextFile.out', x) // Save x as a Text file same rows/cols
-->z1 = read(path+'TextFile.out', 2, 2) // Read from Text file rows, colls
z1 = 0.8497452 0.0683740
0.6857310 0.5608486
-->z1 = read('TextFile.out', 3, 2); // ";" stops the print out
==========================PLOT2D===================================================
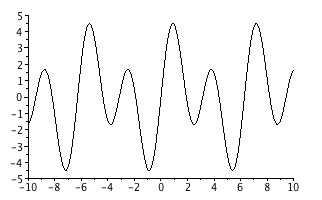
-->x = linspace(-10, 10, 5) // x = - 10. - 5. 0. 5. 10.
-->x = linspace(-10, 10, 1000); // x from -10 to 10 in 1000 steps
-->y = 2*sin(x) + 3*sin(2*x) ;
-->plot2d(x,y) // x y plot
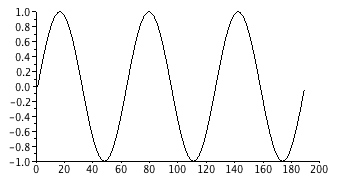
-->t=(0:0.1:6*%pi); // t is 0->6*%pi in 0.1 steps
-->plot2d(sin(t)');
// plot vs index value
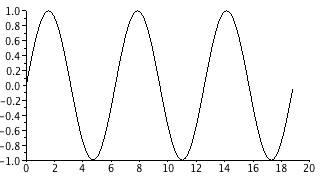
-->clf(); // clears graph
-->plot2d(t',sin(t)');
// plot vs t value
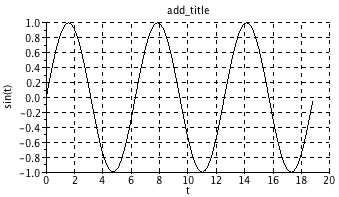
-->xtitle("add_title","t","sin(t)");
//
xtitle("title","x_lab","y_lab");
-->xgrid(); //xgrid([color]) add a grid
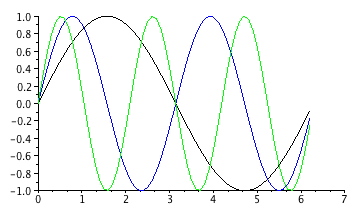
-->x=[0:0.1:2*%pi]';
-->plot2d(x,[sin(x) sin(2*x) sin(3*x)]) //multiple plot
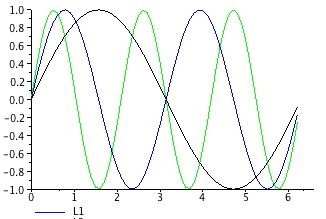
-->x=[0:0.1:2*%pi]';
-->plot2d(x,[sin(x)
sin(2*x)],[1,2],leg="L1@L2"); //legends
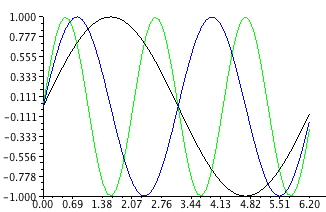
-->plot2d(x,[sin(x)
sin(2*x)],nax=[2,10,2,10]); // axes labels/tics
[nx,Nx,ny,Ny]
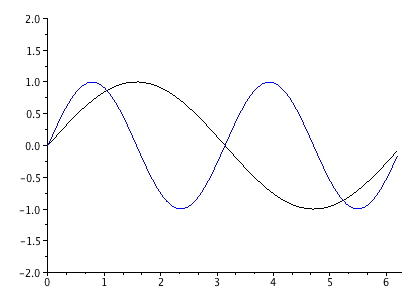
-->plot2d(x,[sin(x) sin(2*x)],rect=[0,-2,2*%pi,2]); //view window [xmin,ymin,xmax,ymax]
-->clf();
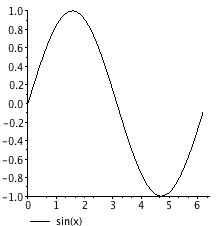
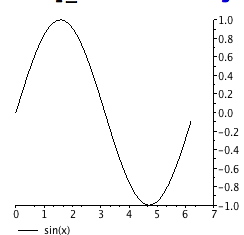
-->x=[0:0.1:2*%pi]';
-->plot2d(x,sin(x),leg="sin(x)");
//
add legend
-->a=gca(); // gca() returns Handle on axes entity
-->a.y_location ="right"; // axis on the right
-->clf();
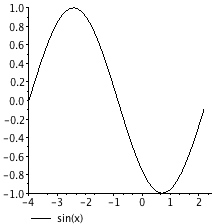
-->plot2d(x-4,sin(x),1,leg="sin(x)");
// Offset x on plot
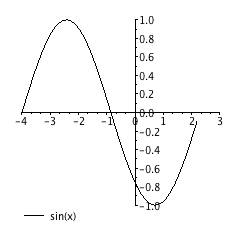
-->a=gca(); // gca() returns Handle on axes entity
-->a.x_location = "middle";
-->a.y_location = "middle"; // axis centered at (0,0)
-->clf();
-->plot2d(x,sin(x),1,frameflag= 4); // isoview
-->clf();
-->plot2d(x,sin(x),1,frameflag= 6); // scale
-->clf();
-->plot2d(x,sin(x), -1);
// auto scaling
-->plot2d(x,2*sin(x),12);
-->plot2d(2*x,cos(x), 3);
==========================PLOT2D_SEMILOG=====================================
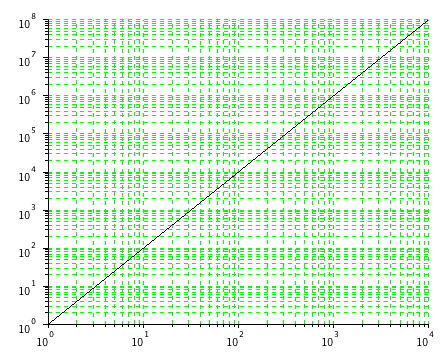
-->x=(1:10:10000); // x is 1->10000 stepsize =10
-->y=x^2; // y=x^2 print out values
-->plot2d(x,y, logflag="ll" ) // logx/logy plot
-->xgrid(3);
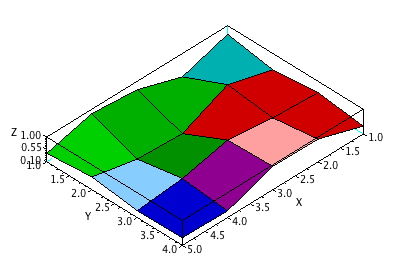
==========================PLOT3D===================================================
-->z = rand(5, 4) // Z = 5 row 4 col
z = 0.6856896 0.4094825 0.5896177 0.3873779
0.1531217 0.8784126 0.6853980 0.9222899
0.6970851 0.1138360 0.8906225 0.9488184
0.8415518 0.1998338 0.5042213 0.3435337
0.4062025 0.5618661 0.3493615 0.3760119
-->x=[1:1:5]; // x = 1 2 3 4 5
-->y=[1:1:4]; // y = 1 2 3 4
-->[xx,yy,zz]=genfac3d(x,y,z); // maps z to 3D
-->plot3d1(xx,yy,zz)
-->t=[0:0.3:2*%pi]';
-->z=sin(t)*cos(t'); // simple plot using z=f(x,y)
-->plot3d1(t,t,z)
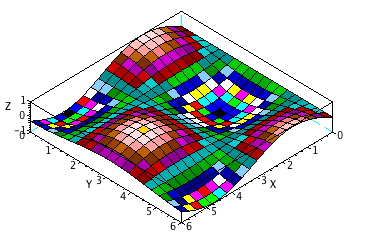
-->[xx,yy,zz]=genfac3d(t,t,z); // same plot using genfac3d
-->clf();
-->plot3d1(xx,yy,zz)
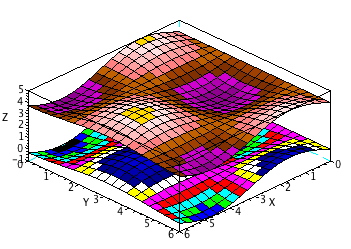
-->clf();
-->plot3d1([xx xx],[yy yy],[zz 4+zz]) // multiple plots
-->clf() ;
-->plot3d1(1:10,1:20,10*rand(10,20),35,45,"X@Y@Z",[2,2,3]) // with viewpoint and captions
==========================SOUND===================================================
-->t=soundsec(0.5); // soundsec(sec [,Int_samp/sec])
-->[nr,nc]=size(t) // find size array t nr=1 nc=11025.
-->s=sin(440*t)+sin(220*t)/2+sin(880*t)/2; // create sound array s
-->plot2d(s);
//
plot s vs index
-->plot2d(t,s); // plot s vs time
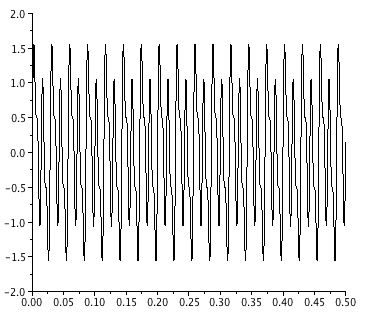
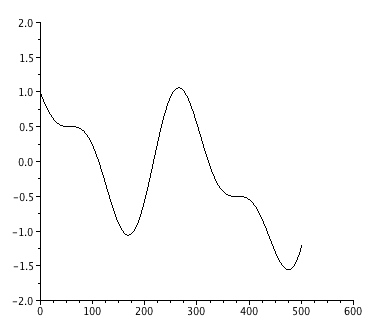
-->plot2d(s(100:600)) // plot subset of s
-->s=s/max(abs(s)); // normalize s
-->plot2d(s);
-->path='/Users/donsauer/Downloads/scilab/' // directory to save files
-->savewave( path+'SaveSound.wav',s); // save s as a wave file
-->write( path+ 'waveData.out' ,s); // save s as a text file
-->s1=loadwave(path+'SaveSound.wav'); // reload wave file
-->plot2d(s1);
-->[y,Fs,bits]=wavread(path+'SaveSound.wav') // load unknown y=wave bits=16 Fs=22050
-->plot2d(y);
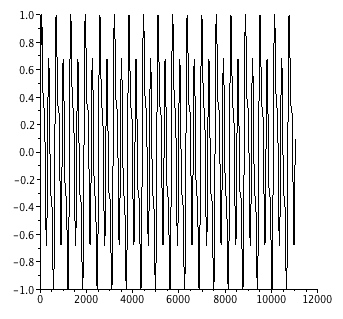
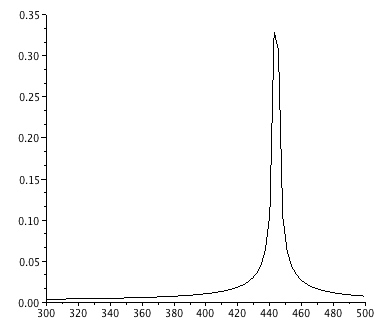
-->t=soundsec(0.5); // create 0.5 seconds of sound parameters.
-->s=sin(2*%pi*440*t); // Then we generate the sound.
-->analyze(s);
-->analyze(s,300,500,22050); // freq plot fmin,fmax,rate,points
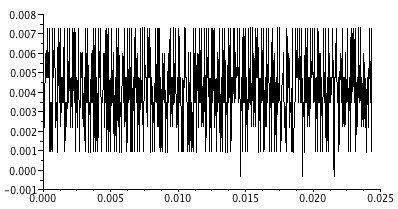
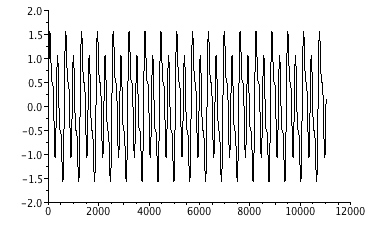
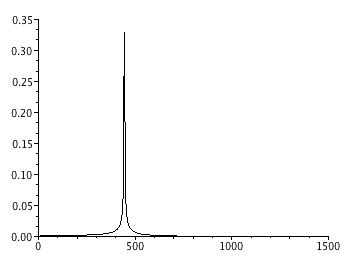
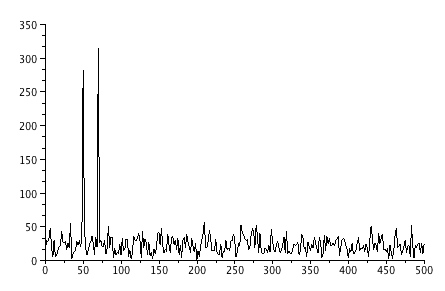
-->sample_rate=1000;
-->t = 0:1/sample_rate:0.6; // at 50 and 70 Hz
-->N=size(t,'*'); //number of samples
-->s=sin(2*%pi*50*t)+sin(2*%pi*70*t+%pi/4)+grand(1,N,'nor',0,1);
-->y=fft(s); // fft retain only first N/2 points
-->f=sample_rate*(0:(N/2))/N; // create frequency vector
-->n=size(f,'*')
-->clf()
-->plot2d(f,abs(y(1:n)))
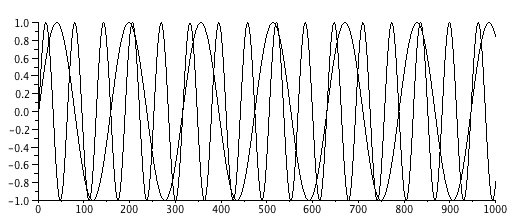
-->t=soundsec(0.5); // sound
-->s3 =[sin(2*%pi*140*t);sin(2*%pi*350*t)]; // Generate two channels sound.
-->plot2d( s3(1,1:1000) )
-->plot2d( s3(2,1:1000) )
==========================BODE===================================================
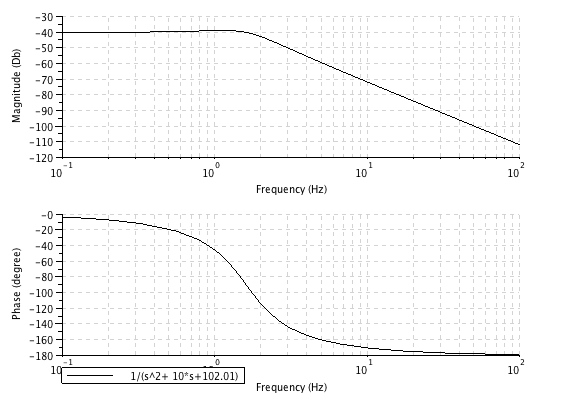
-->s=poly(0,'s') // define s as a poly symbol
-->h=syslin('c', 1 /(s^2+ 10*s+102.01)) // trans func 'c'= continue ,'d' discrete
-->titl='1/(s^2+ 10*s+102.01)'; // define title
-->bode(h,0.1,100,titl);
-->halt
==========================READEXCEL==========================================
-->path='/Users/donsauer/Downloads/scilab/' // directory to save files
-->Sheets = readxls(path+'MyData.xls')
// need to
resave as old excel
-->s1=Sheets(1);
// get
the first sheet
-->[nc,nr]=size(s1);
// get array size
-->s1(19,1)
// Delta_X
-->s1(19,2))
// 0.00025
-->w3(:,1)=s1(22:nc,1);
// define time
-->w3(:,2)=s1(22:nc,2); // define wave
-->plot2d(w3(:,1)',w3(:,2)')
// xy plot